The Trusted Name In Industrial Chemical Supplies

| 2020 RM'000 | 2021 RM'000 | 2022 RM'000 | 2023 RM'000 | 2024 RM'000 | |
|---|---|---|---|---|---|
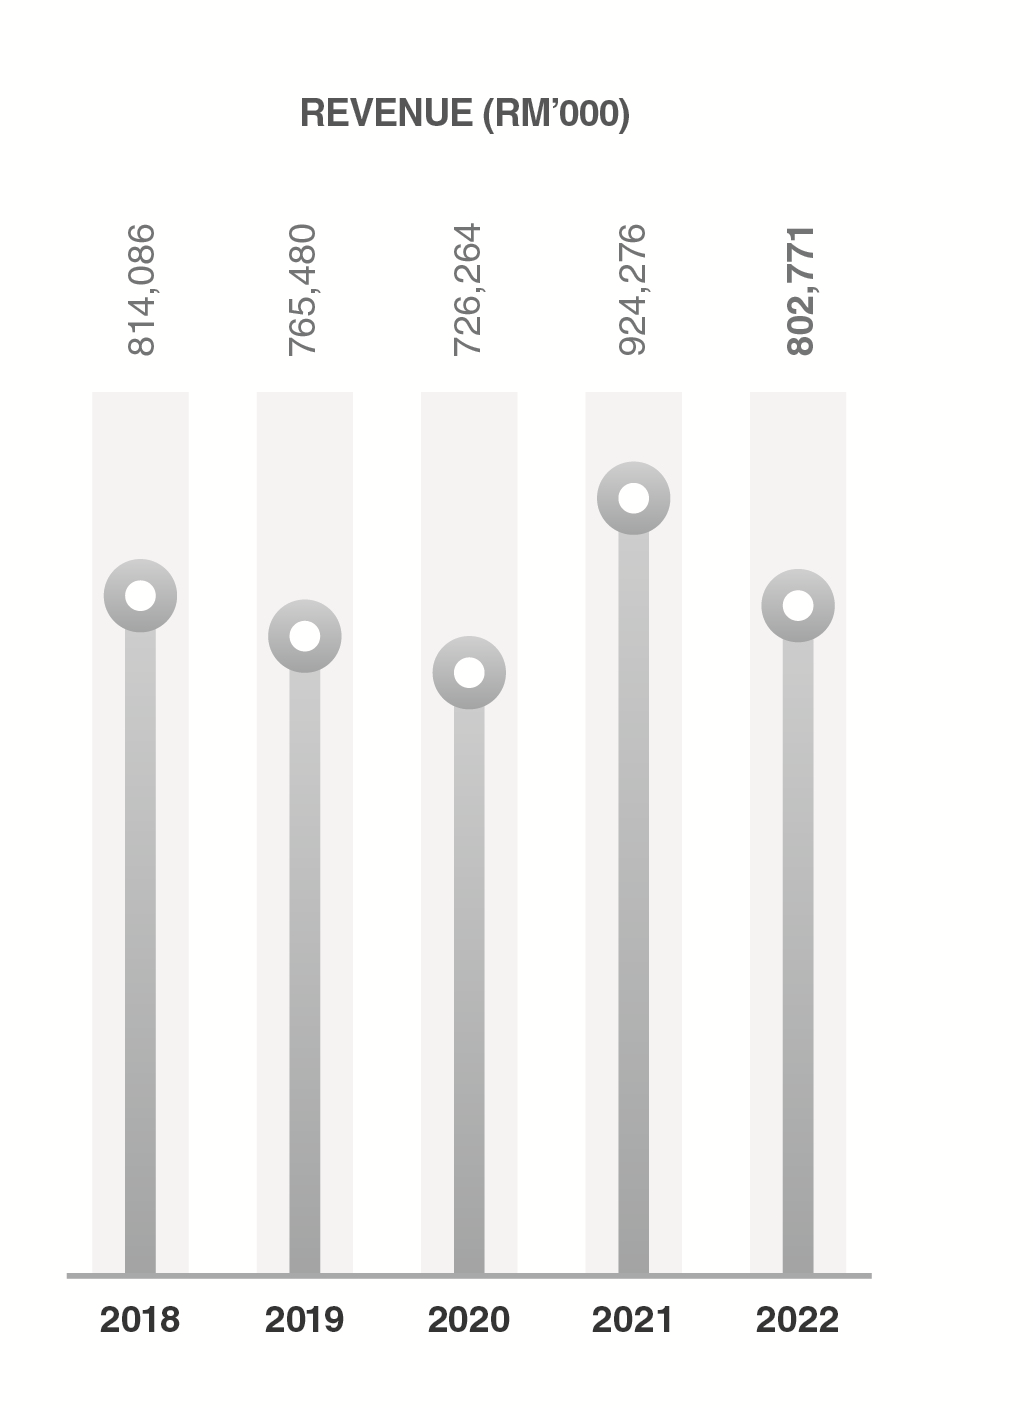
| Revenue | 726,264 | 924,276 | 802,771 | 653,527 | 795,375 |
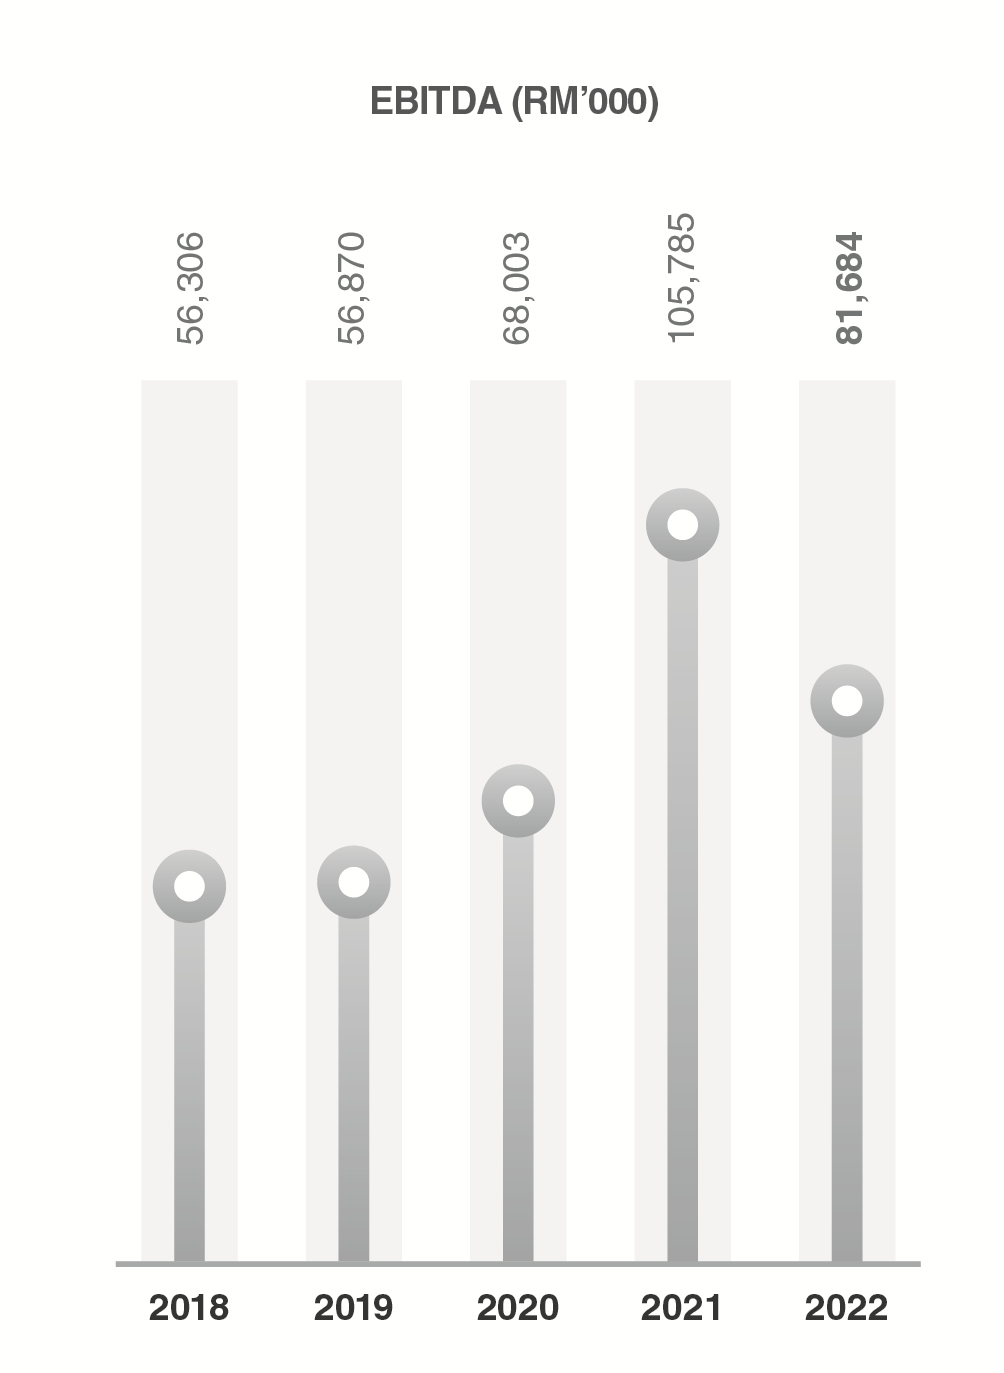
| Earnings before interest, tax, depreciation and amortisation ("EBITDA") | 68,003 | 105,785 | 81,684 | 68,752 | 86,260 |
| Profit Before Taxation ("PBT") | 62,523 | 98,391 | 68,616 | 57,727 | 79,694 |
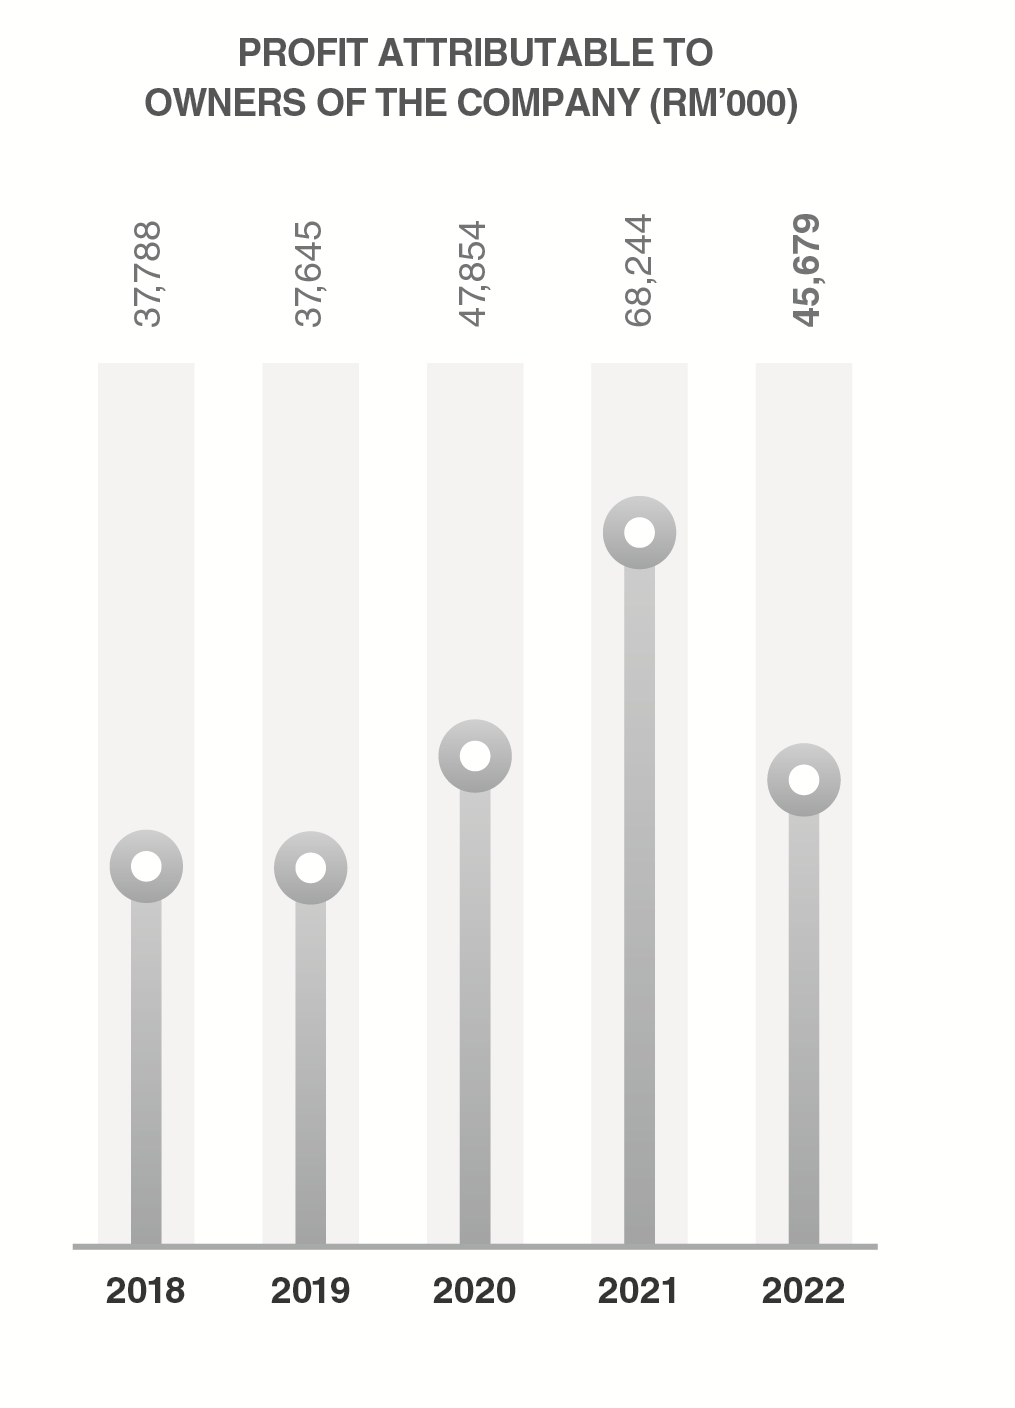
| Profit Attributable to Owners of the Company | 47,854 | 68,244 | 45,679 | 37,061 | 48,000 |
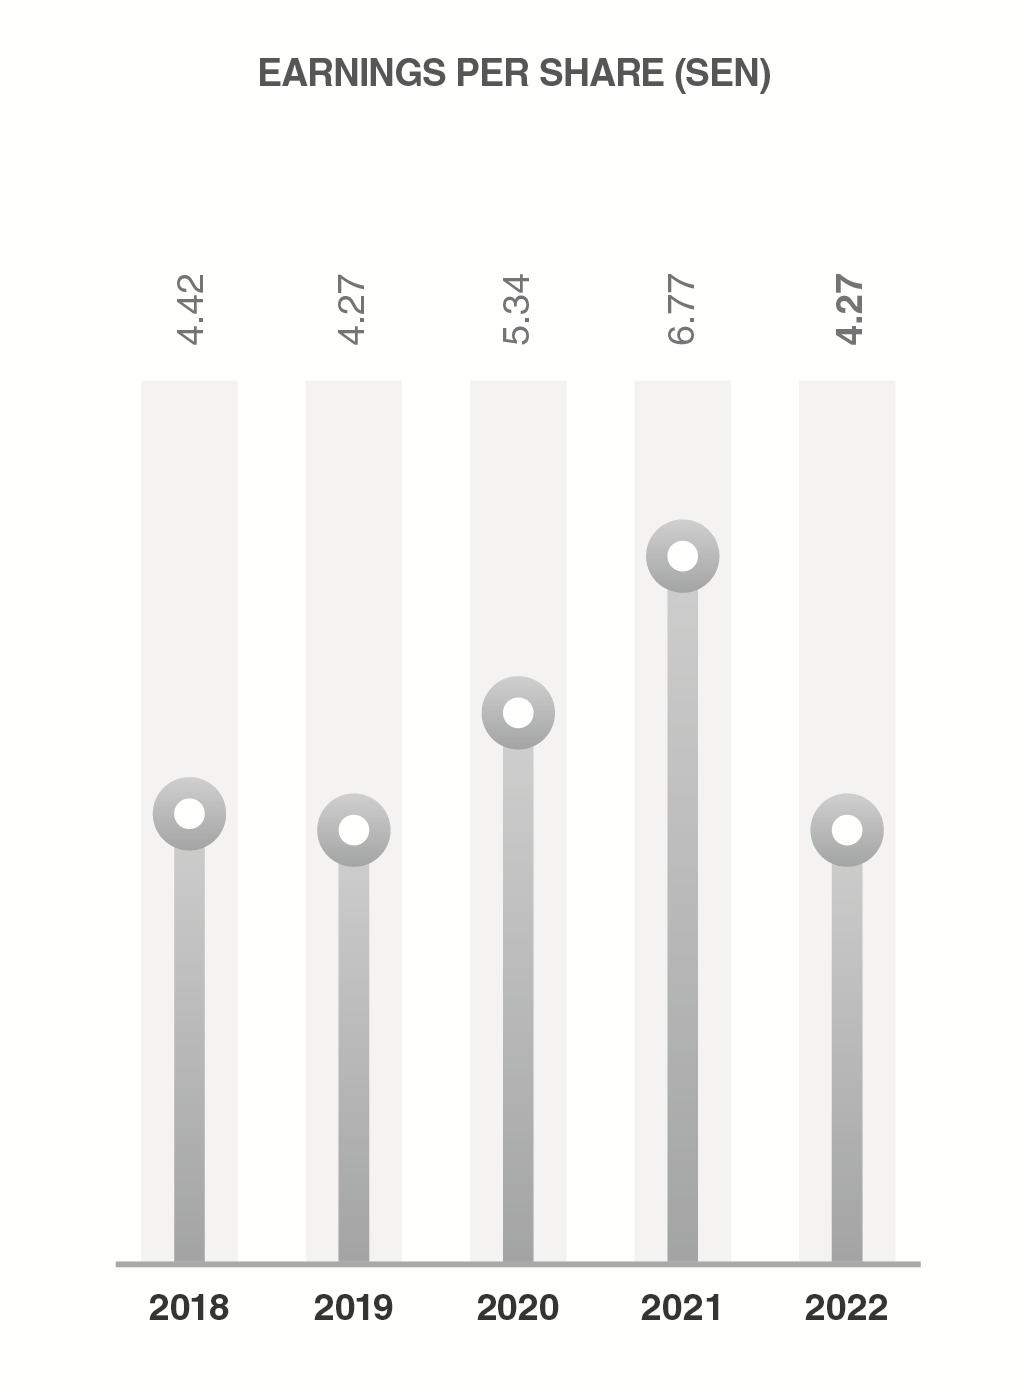
| Earnings Per Share - Basic (sen)* | 5.34 | 6.77 | 4.27 | 3.46 | 4.49 |
| Earnings Per Share - Diluted (sen)* | - | - | - | - | - |
Computed based on Profit Attributable to Owners of the Company and divided by the weighted average number of shares in issue during the financial year ended 31 December 2024 of 1,069,766,119.
Fully diluted earnings per share were not computed as at 31 December 2024 as there were no outstanding potential ordinary shares to be issued.
Computed based on Profit Attributable to Owners of the Company and divided by the weighted average number of shares in issue during the financial year ended 31 December 2023 of 1,069,766,119.
Fully diluted earnings per share were not computed as at 31 December 2023 as there were no outstanding potential ordinary shares to be issued.
Computed based on Profit Attributable to Owners of the Company and divided by the weighted average number of shares in issue during the financial year ended 31 December 2022 of 1,069,766,119.
Fully diluted earnings per share were not computed as at 31 December 2022 as there were no outstanding potential ordinary shares to be issued.
Computed based on Profit Attributable to Owners of the Company and divided by the weighted average number of shares in issue during the financial year ended 31 December 2021 of 1,008,140,289.
Fully diluted earnings per share were not computed as at 31 December 2021 as there were no outstanding potential ordinary shares to be issued.
Computed based on Profit Attributable to Owners of the Company and divided by the weighted average number of shares in issue during the financial year ended 31 December 2020 of 895,808,553.
Fully diluted earnings per share were not computed as at 31 December 2020 as there were no outstanding potential ordinary shares to be issued.


| Names | Direct Holdings | Indirect Holdings (excluding bare trustees) | ||
| No | %* | No | %* | |
| Chemplex Resources Sdn. Bhd. | 416,320,000 | 38.931 | 0.000 | 0.000 |
| Tang Ying See | 19,096,400 | 1.785 | 448,312,800 (a) | 41.922 |
| Chin Song Mooi | 10,278,000 | 0.961 | 457,131,200(b) | 42.746 |
| Tan Sri Dato' Lim Kuang Sia | 10,600,000 | 0.991 | 77,419,600(c) | 7.239 |
| Lim Woi Kok | 400,000 | 0.037 | 57,687,400(d) | 5.394 |
| Lim Seow Kiang | 500,000 | 0.046 | 57,687,400(d) | 5.394 |
| Lim Siew Bing | 300,000 | 0.028 | 57,687,400(d) | 5.394 |
| Lim Leng Bung (L) Foundation | 0 | 0.000 | 57,687,400(e) | 5.394 |
| Lim Kuang Yong (L) Foundation | 0 | 0.000 | 57,687,400(e) | 5.394 |
| Lim Kuang Sia (L) Foundation | 0 | 0.000 | 57,687,400(e) | 5.394 |
| Lim Kwan Hwa (L) Foundation | 0 | 0.000 | 57,687,400(i) | 5.393 |
| Lim Kuang Wang (L) Foundation | 0 | 0.000 | 57,687,400(e) | 5.394 |
| Lim Kuang Yong | 0 | 0.000 | 57,687,400(f) | 5.394 |
| Lim Leng Bung | 0 | 0.000 | 57,687,400(g) | 5.394 |
| Lim Kuang Wang | 0 | 0.000 | 57,687,400(h) | 5.394 |
| Kossan Holdings (M) Sdn. Bhd. | 57,687,400 | 5.394 | 0 | 0.000 |