The Trusted Name In Industrial Chemical Supplies

| 2013 RM'000 | 2014 RM'000 | 2015 RM'000 | 2016 RM'000 | 2017 RN'000 | |
|---|---|---|---|---|---|
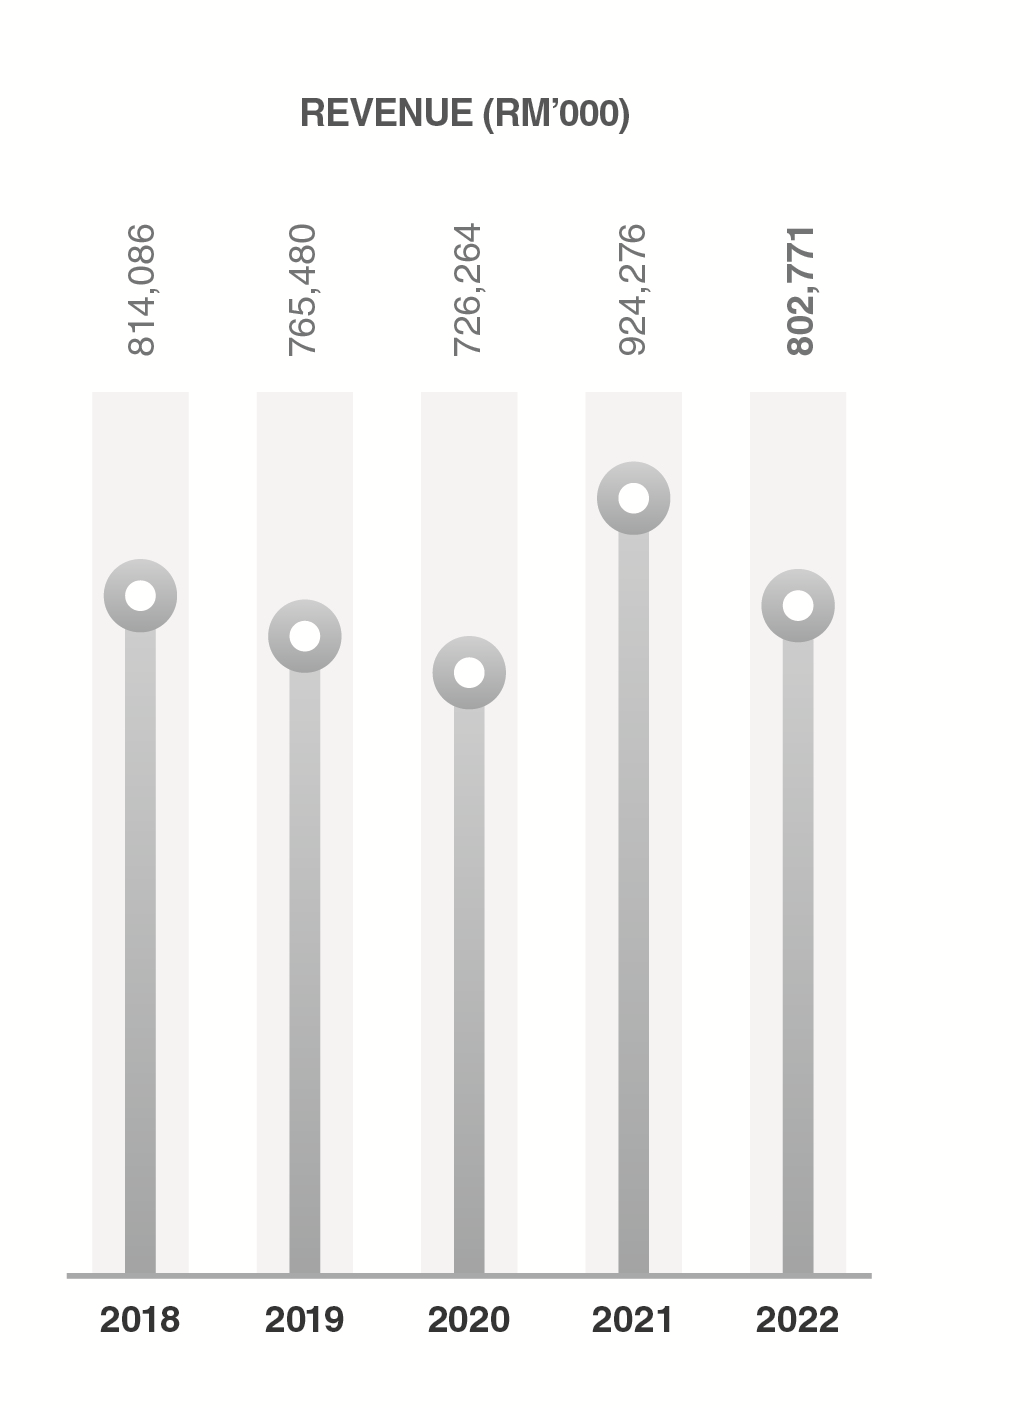
| Revenue | 524,937 | 603,522 | 686,754 | 701,549 | 806,710 |
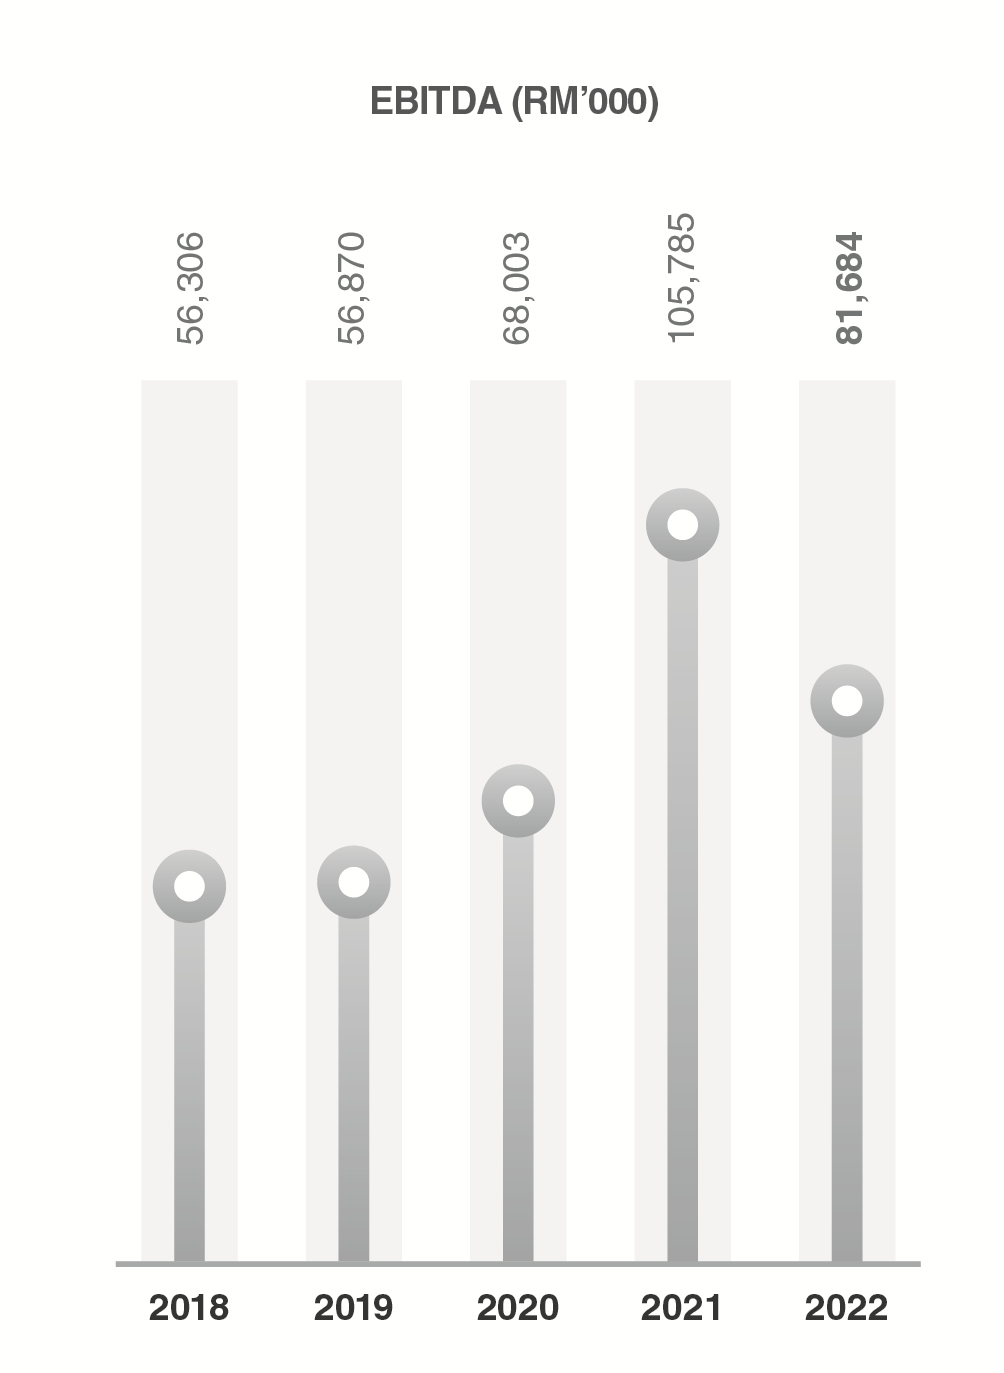
| Earnings before interest, tax, depreciation and amortisation ("EBITDA") | 28,268 | 32,510 | 56,650 | 62,457 | 59,998 |
| Profit Before Taxation ("PBT") | 26,169 | 29,578 | 54,397 | 59,078 | 55,781 |
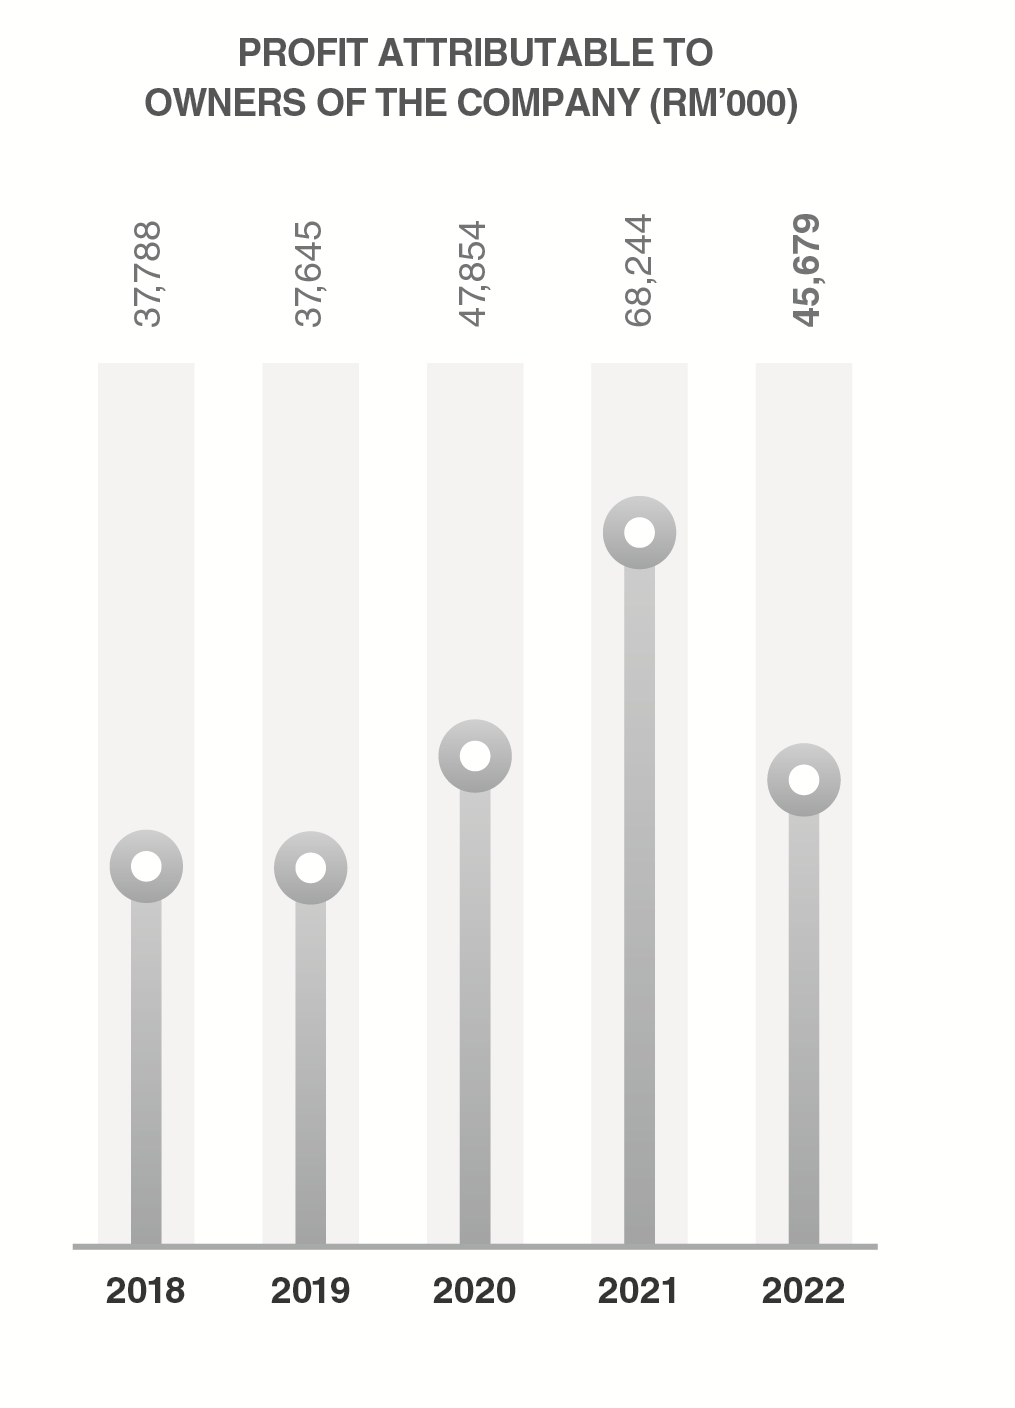
| Profit Attributable to Owners of the Company | 19,648 | 21,961 | 39,735 | 43,499 | 40,743 |
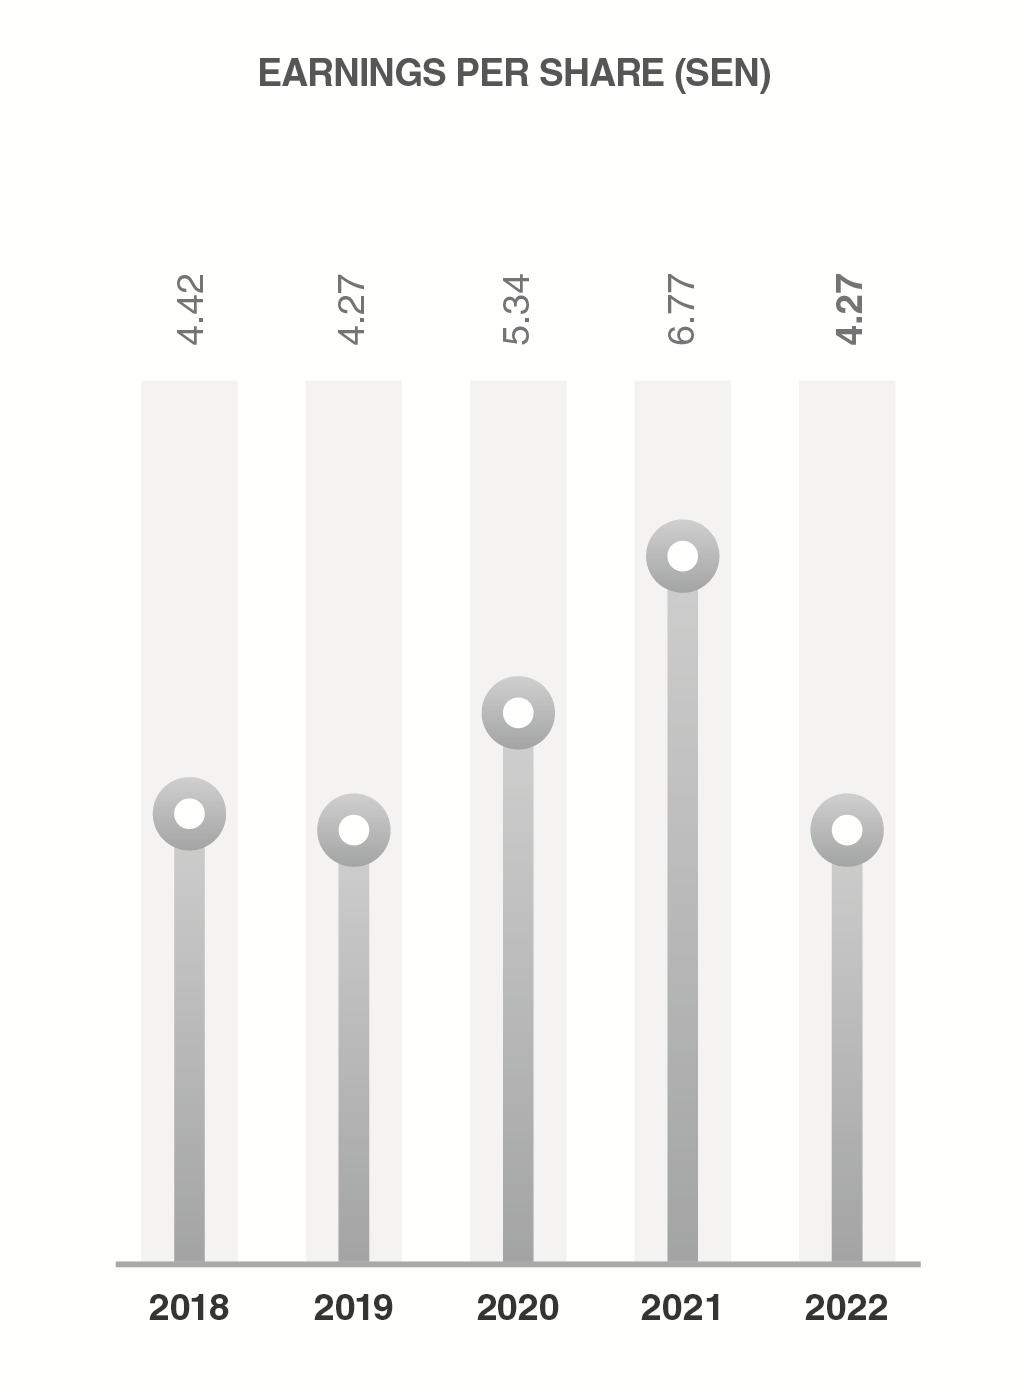
| Earnings Per Share - Basic (sen)* | 2.52 | 2.82 | 5.04 | 5.34 | 4.86 |
| Earnings Per Share - Diluted (sen)* | - | - | 4.88 | 5.11 | 4.67 |
Computed based on Profit Attributable to Owners of the Company and divided by the weighted average number of shares in issue during the financial year ended 31 December 2017 of 837,810,471.
Computed based on Profit Attributable to Owners of the Company and divided by the adjusted weighted average number of shares in issue during the financial year ended 31 December 2017 of 872,024,391.
Upon the completion of the Company’s share split exercise on 8 September 2017, the issued and paid-up ordinary shares of the Company as of that date were increased from 281,617,551 shares to 844,852,653 shares. The share split involved a subdivision of one (1) existing ordinary share into three (3) ordinary shares.
The weighted average number of ordinary shares in issue during the financial years 2013, 2014, 2015 and 2016 have been adjusted to take into effect of the share split exercise undertaken by the Company on 8 September 2017 as highlighted above.
| Names | Direct Holdings | Indirect Holdings (excluding bare trustees) | ||
| No | % | No | % | |
| Chemplex Resources Sdn. Bhd. | 411,420,000 | 48.648 | - | - |
| Tang Ying See | 5,400,000 | 0.638 | 416,711,700 (a) | 49.275 |
| Chin Song Mooi | 5,291,700 | 0.625 | 416,820,000 (a) | 49.287 |
| Chow Cheng Moey | 68,932,200 | 8.150 | 600,000 (b) | 0.071 |